Dashboard
Live Metrics
Live Metrics show the real-time live data of users and messages. It updates every 5 seconds.
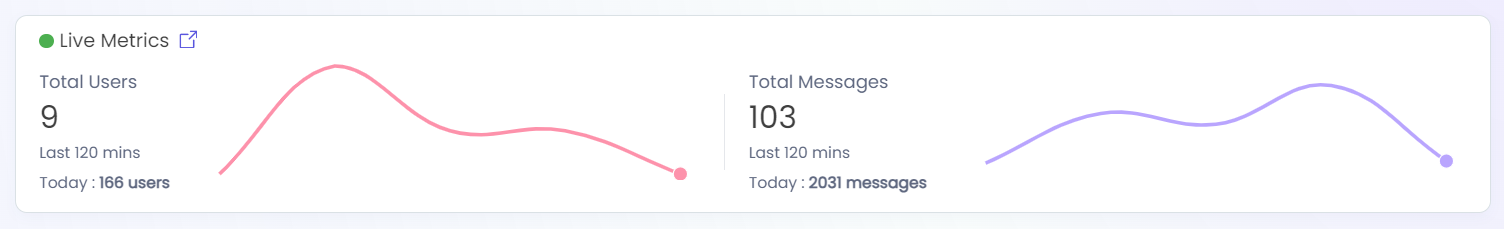
- Total Users shows the total users sessions that have been created in the past 120 mins and created today.
- Total Messages shows the total messages that have been created in the past 120 mins and created today.
Please note that for time slots between 00:00 AM - 02:00 AM, data for the past 120 mins will be fetched from the previous day as well.
You can find a more detailed view of the trends over time by clicking the icon next to the Live Metrics section header.
Date Filter
The start date and end date can be selected from the date filter. All metrics and graphs below the date filter are affected by the selected dates. By default, the metrics and graphs show the last 7 days data.
Export
The Export option enables you to download the data present on the Dashboard. You can select which data you wish to export and if you need past data as well.
Benchmarking (Change percentage)
This feature shows if there has been a rise or dip in the metrics compared to the previous date range. A rise is shown by a green arrow pointing upwards and dip is shown by a red arrow pointing downwards.
The previous date range considered for bench-marking will always be equal to the current date range used for bench-marking. For example, if the current select date range is 15 Jun - 21 Jun (7 Days), previous date range considered for comparison will be 8 Jun - 14 Jun (7 Days).
Message Insights
This section provides metrics pertaining to messages, including total count, the bifurcation, and trends over time.
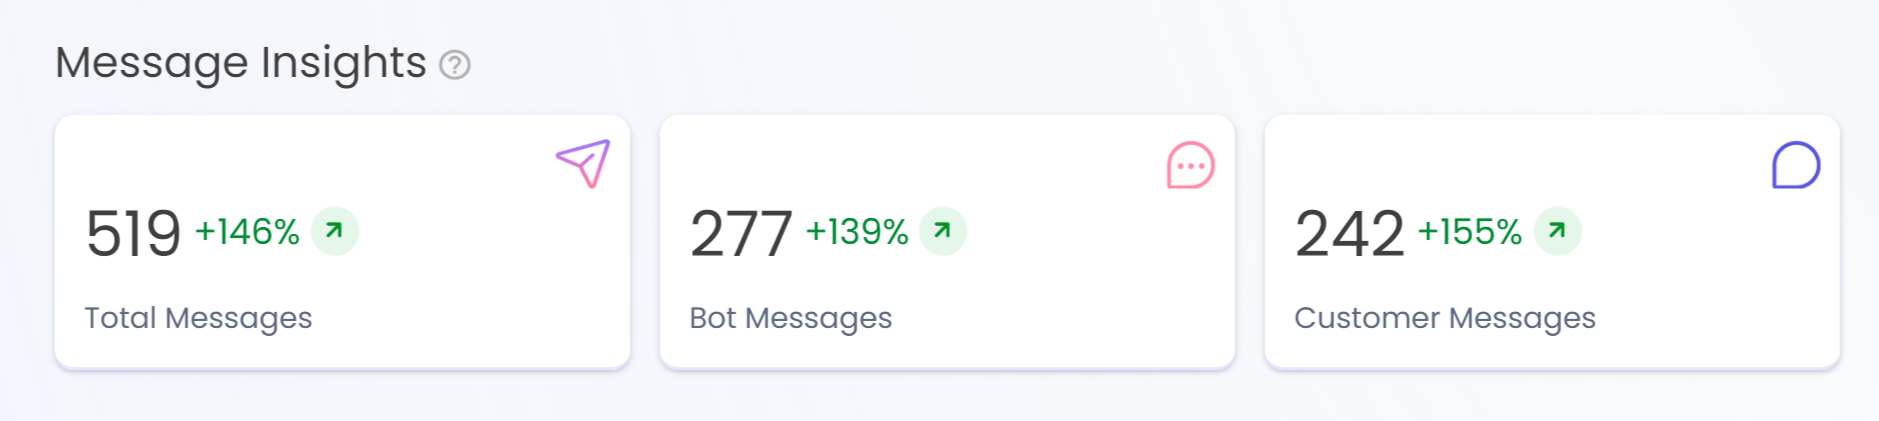
- Total Messages is the total number of messages exchanged between the bot and the customer
- Bot Messages is the number of messages given as an output by the bot.
- Customer Messages is the number of messages given as an input by the customers.
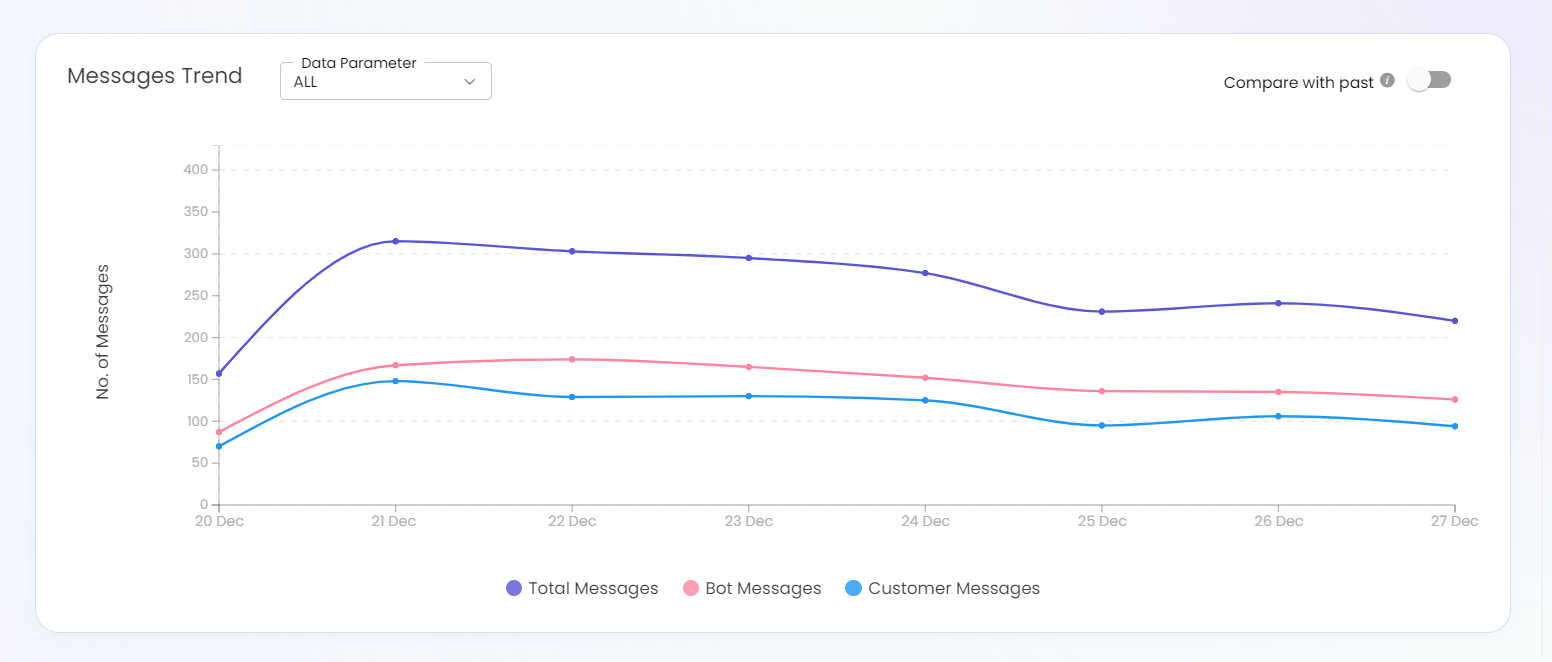
Messages Trend
The line graph showcasing the conversations created on the bot by the customer. The message trend further bifurcates into the bot and the customer message trend.
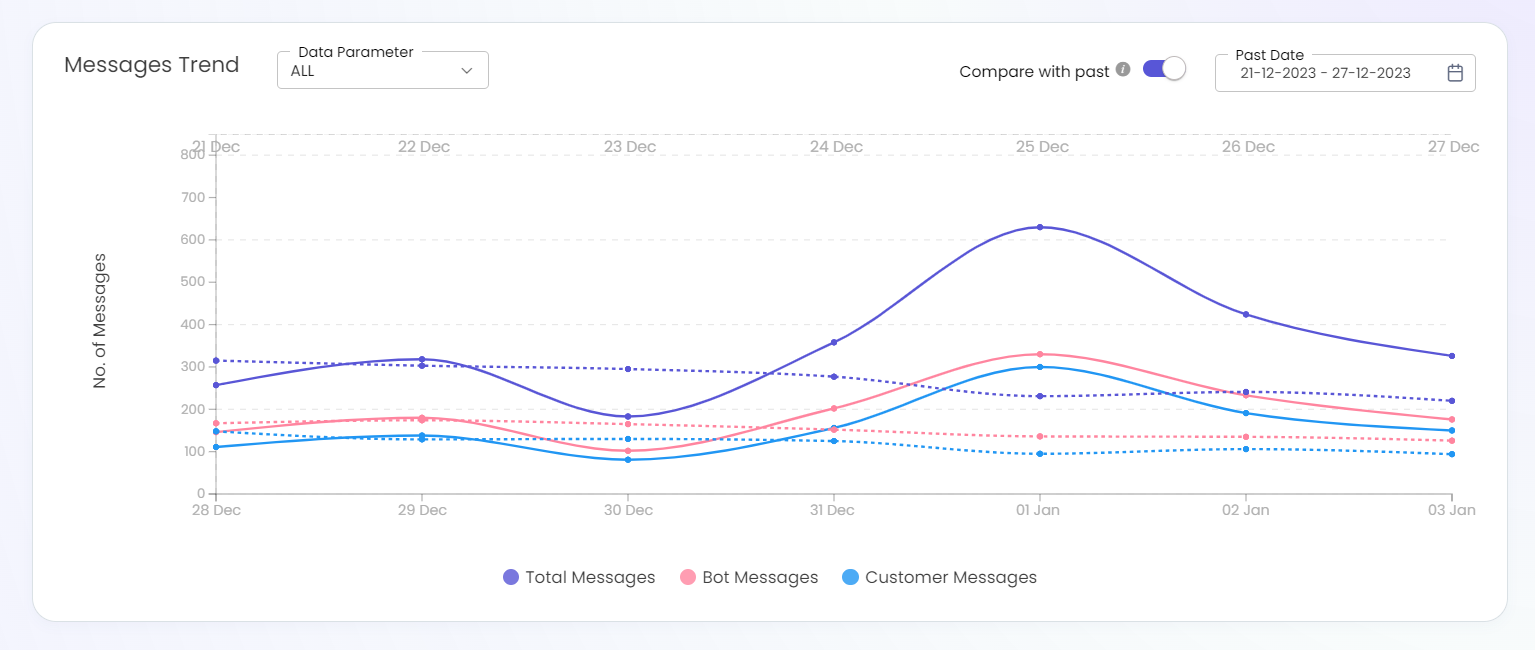
You can compare the current trends with past trends using the Compare with past feature. The past trends (dotted lines) are superimposed onto the current trends (solid lines) for easy comparison.
The Compare with past date filter allows you to only select the time period set in the Dashboard date filter. For example, if you have selected the past week in the Dashboard date filter, you can only select 7days as a date range in the Compare with past date filter.
Conversations Insights
This section provides metrics pertaining to conversations (sessions), including total count, conversation depth and trends over time.
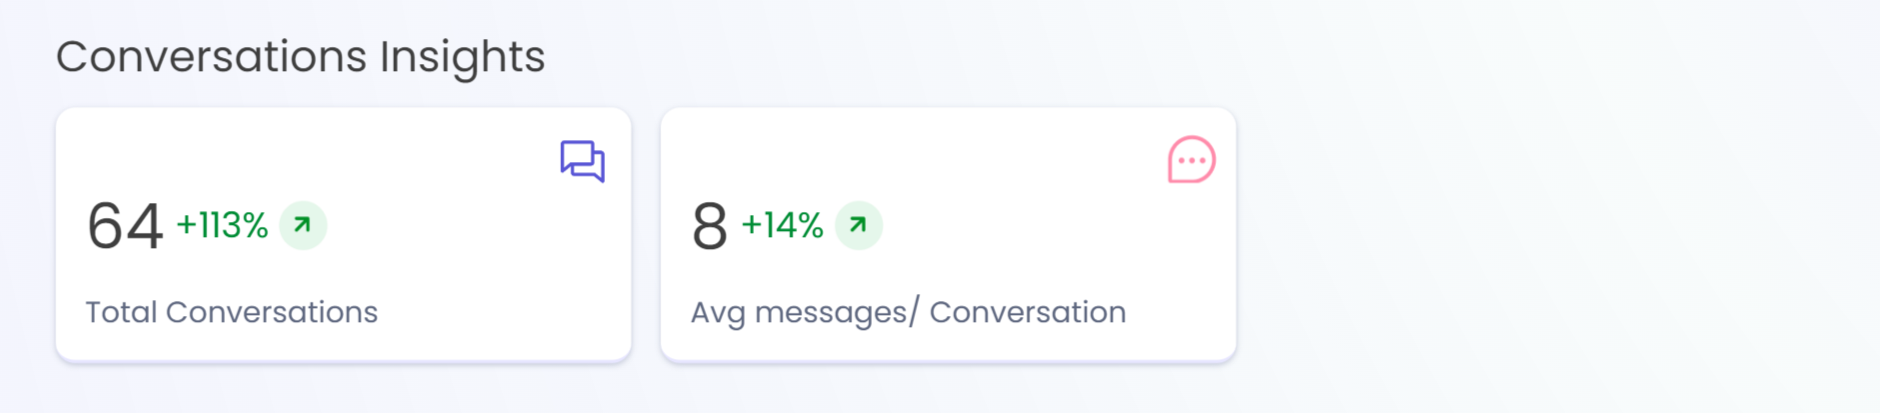
- Total Conversations is the total number of conversations (sessions) created with the bot for a given time frame.
- Avg Messages/ Conversation is the average number of messages which were exchanged in a single conversation. This metric helps to understand the depth of the conversations.
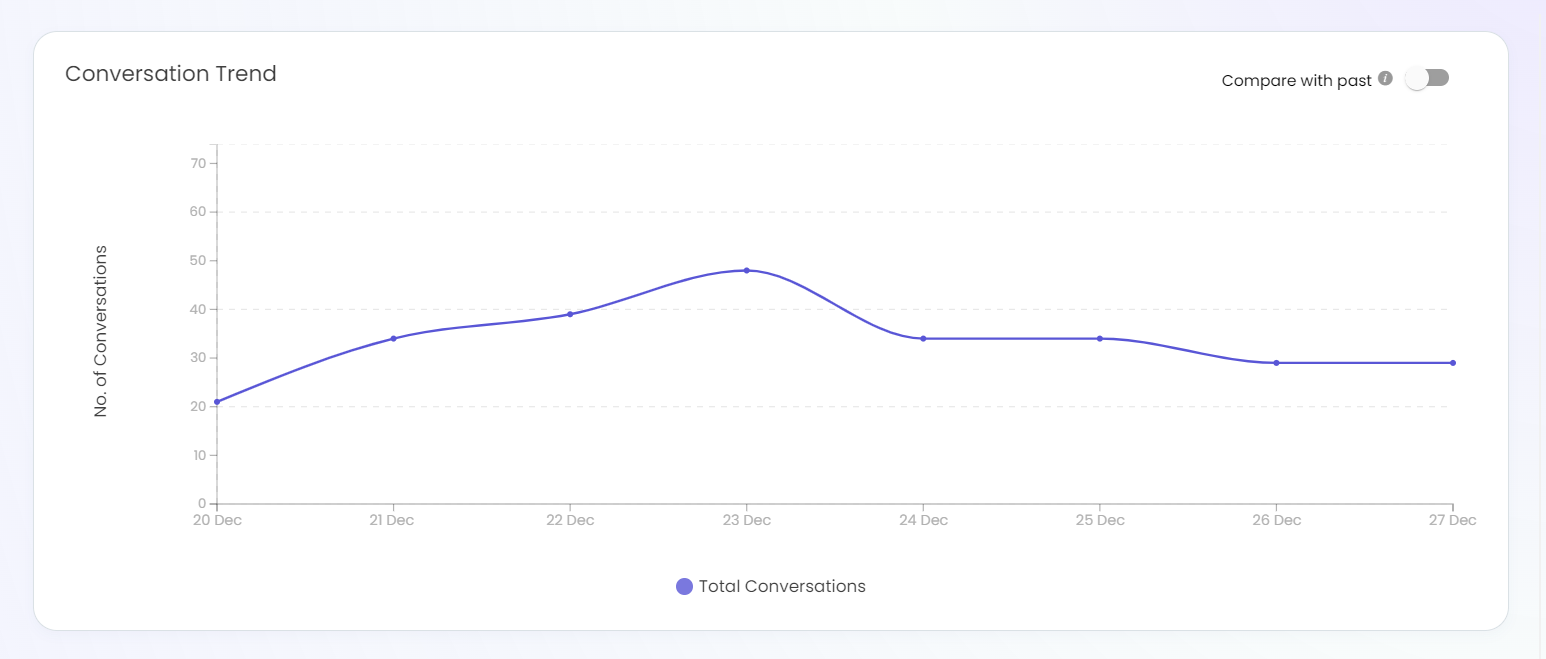
Conversations Trend
The trend showcases the number of total conversations created with the chatbot across days and helps you understand the change in conversations over a period of time.
User Insights
This section provides metrics pertaining to users, including total unique count, retention, engagement and trends over time.
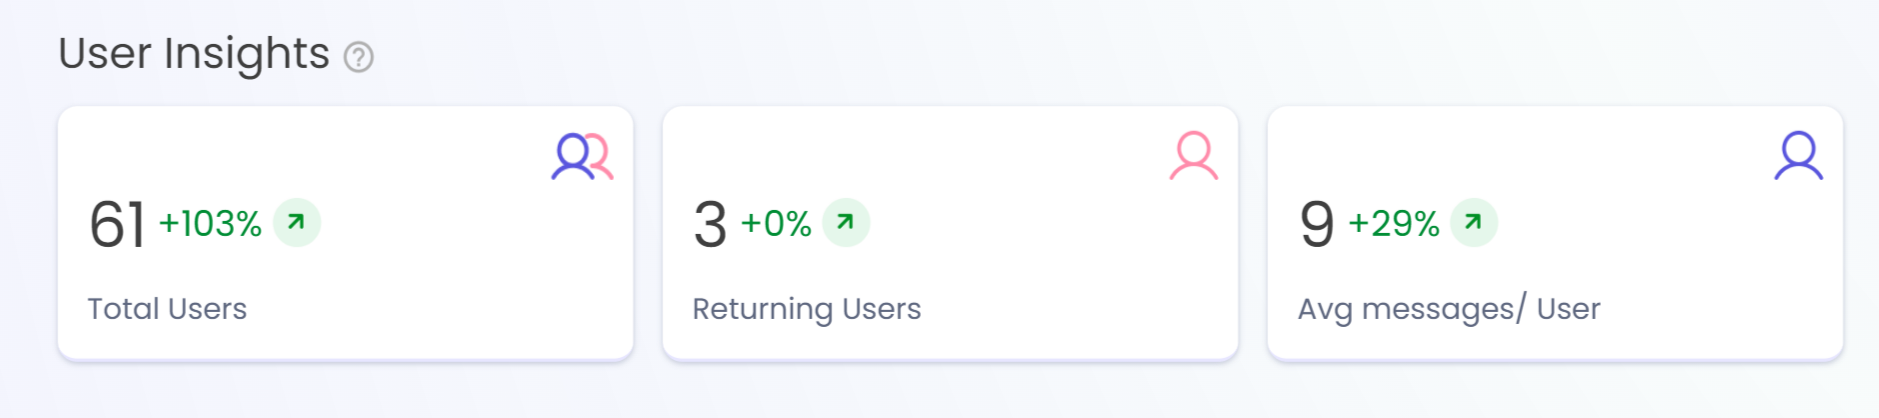
- Total Users is the total number of unique customers who interact with the bot for a given time frame.
- Returning Users is the number of users who interacted with the bot multiple times for a given time frame. These users have more than one session created on the bot within the selected date range.
- Avg Messages/ Users is the average number of messages which were exchanged by a single user. This metric helps to understand the engagement of users.
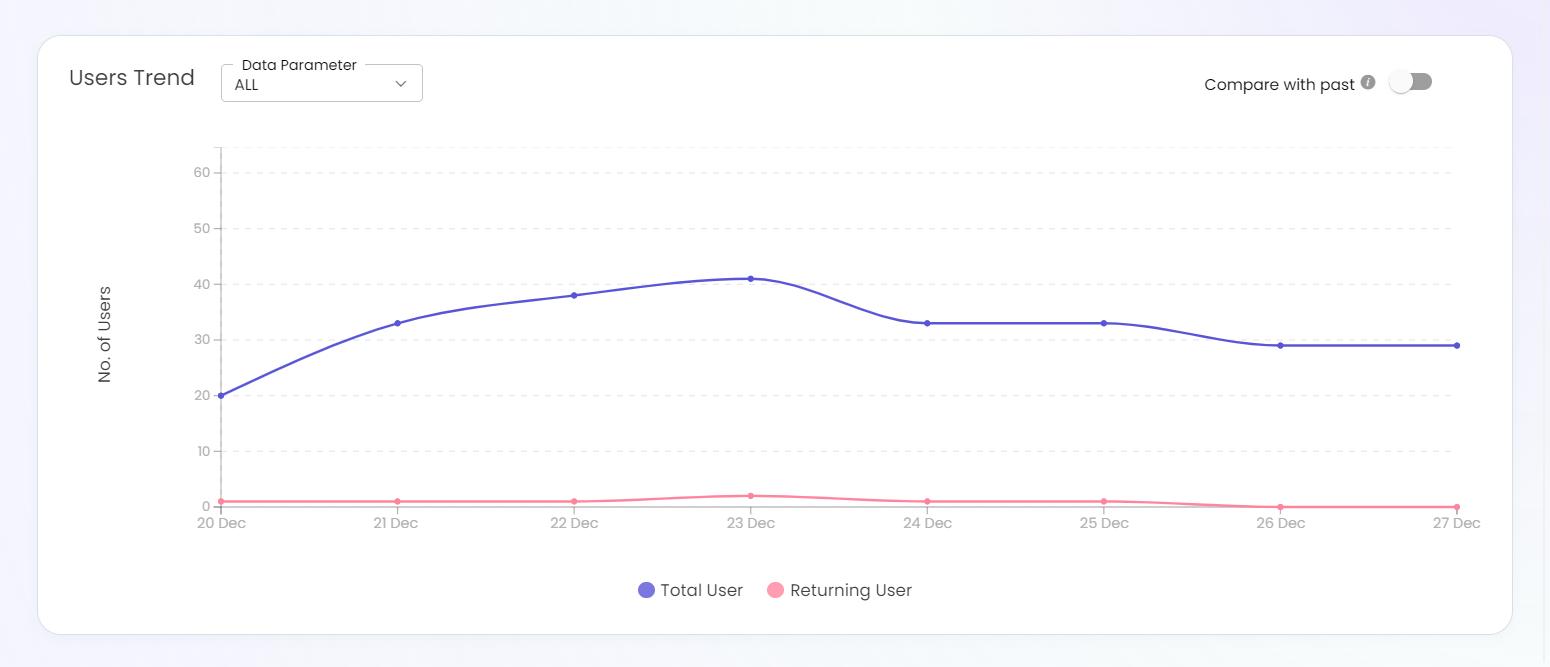
Users Trend
The trend showcases the number of total & returning users interacting with the chatbot across days and helps you understand the change in users over a period of time.
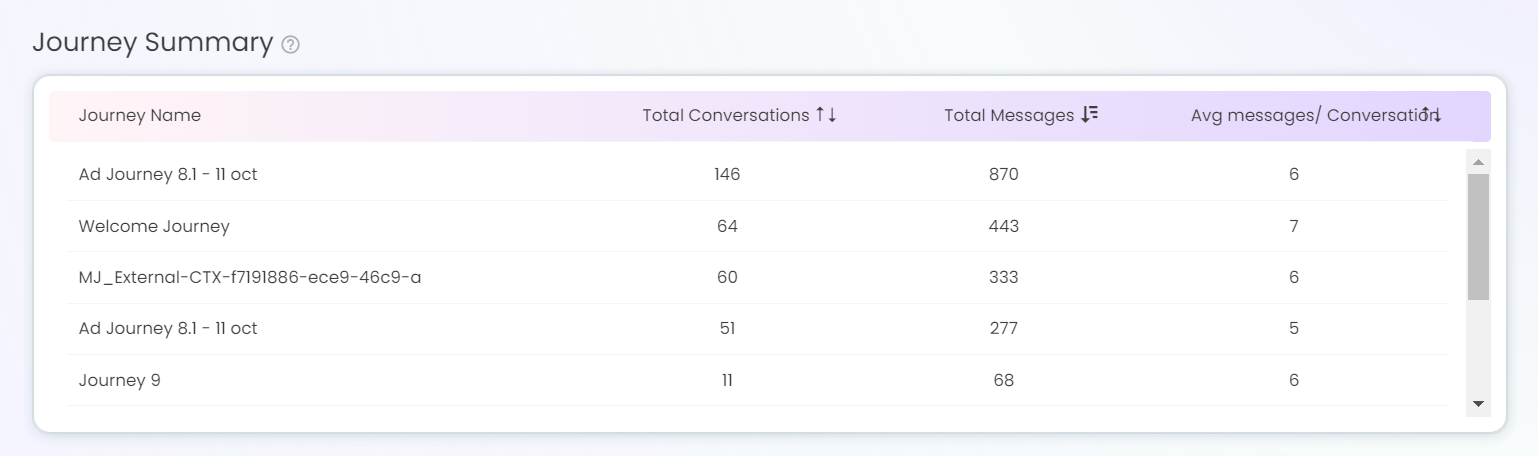
Journey Summary
This table will help you understand how many conversations happened in which journey. It displays a picture of which part of the bot is being used the most and whether the customer's query is being resolved or not.
Updated 9 months ago