Goal Analytics
After creating a Goal and implementing within a journey, you can track it through Goal Analytics.
You can access Goal Analytics for a Goal by clicking the Analytics (pie chart) icon that appears while hovering on a Goal in the Goals Dashboard.
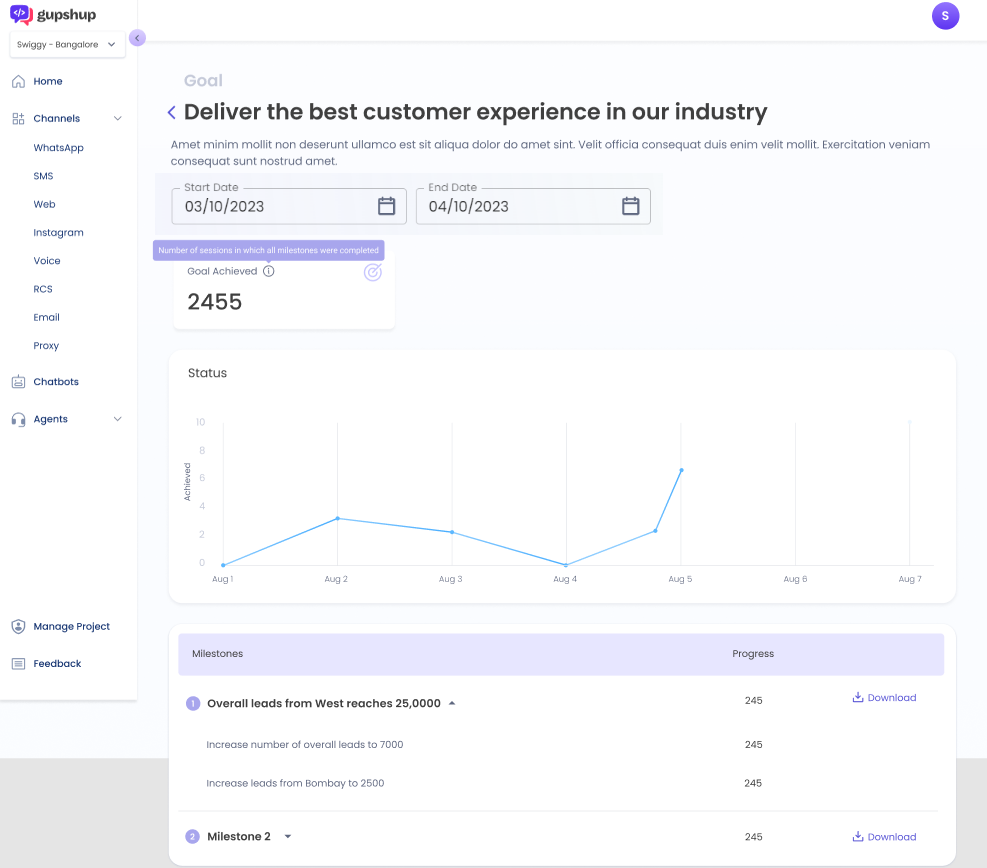
- The name and description of the Goal are present at the top of the screen.
- You can select the time period for your Goal's analytics using the start date and end date filters.
- Goal Achieved represents the number of sessions in which all Milestones of that Goal were achieved.
- The Status line graph displays the time-interval spaced progress of the Goal being achieved.
- The Milestones table displays the progress of individual Milestones and their Trackers being achieved.
NoteThe Download option next to each Milestone provide an Excel file containing a list of all values entered by users for the Trackers of that Milestone.
Downloaded tracker data
Goal Analytics on the Goal Node
You can also get analytics for a Goal by turning on the Analytics toggle present on the Bot Studio Canvas.
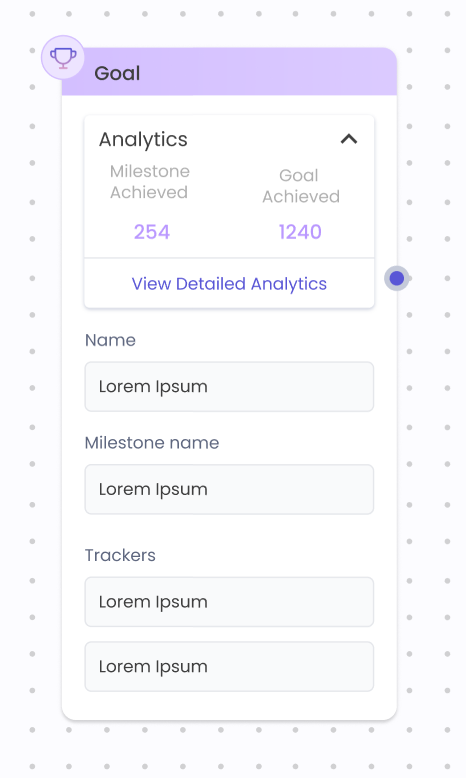
- Milestone Achieved and Goal Achieved will be the two metrics displayed on the Goal Node.
- The metrics will be populated for the Goal and Milestone selected in the node.
- Clicking View Detailed Analytics takes the user to the Goal Analytics of the selected Goal.
Updated 8 months ago
Did this page help you?